ECOLOGY
Responsible use of resources
Responsible use of water
Water is used at our sites in a variety of ways: as a rinsing and cleaning agent during production, as a raw material in products, as a heat transfer medium in cooling processes and for steam production. Water is an essential product component, as water-based processing aids are a key focus of CHT’s business. In addition, water is an important transportation medium for a large proportion of the raw materials we purchase and for the export of our products.
In order to use water resources as efficiently as possible, we focus on water cycle utilization, wastewater treatment and try to build intelligent water cooling systems. A lack of water poses a risk for us.
Commitment in the value chain
We offer our customers products and process solutions that enable them to save water in their production processes, e.g. when dyeing textiles, and above all to reduce the amount of contaminated wastewater.
When dyeing cotton with the 4SUCCESS process (with VARIO BLEACH 3E, SARABID MIP/SPIDER, COTOBLANC SEL and BEZAKTIV GO), up to 30 % of water and wastewater can be saved.
PIGMENTURA by CHT is a pigment-based continuous dyeing process with which up to 96 % of the water used in the standard dyeing process can be reduced.
In our internal terminology and external reporting, we had previously referred to our water use as water consumption, which is also how we defined a 10 % reduction in water consumption in our Strategy 2025. However, the terminology water consumption describes the amount of water that is not returned to a body of water after use. This terminology is used internationally, for this reason we are adapting our previous use of language in this report.
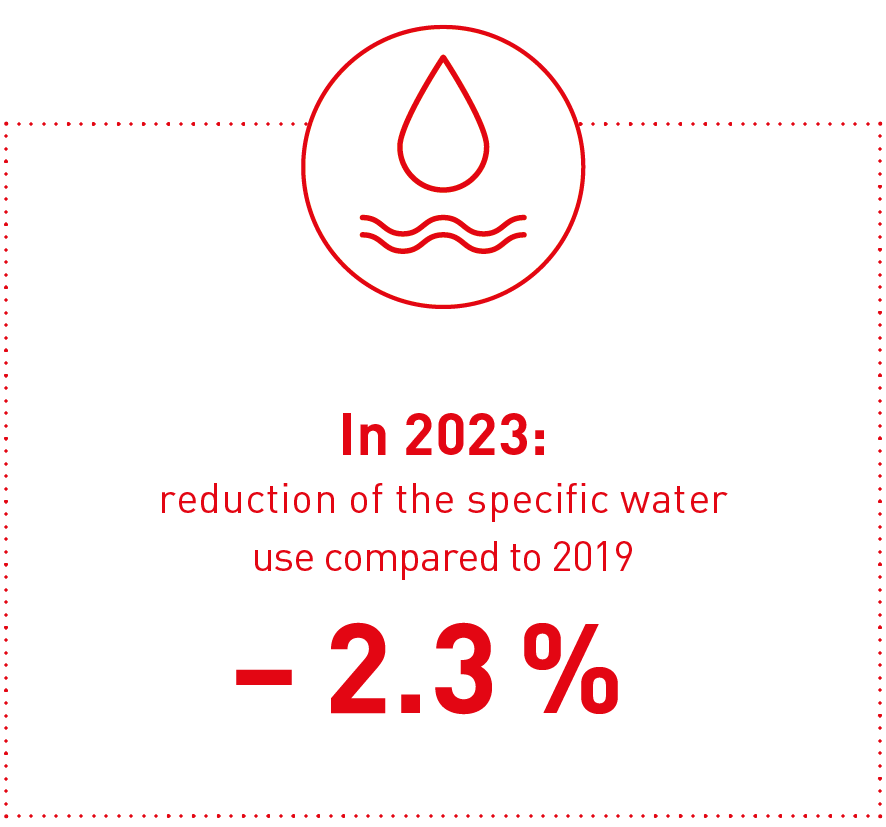
As our water requirements, the wastewater volumes generated and the associated emissions into the water can have an impact on the environment, we have set ourselves the goal of reducing water use and the associated wastewater volumes to a minimum, complying with the legal requirements for the quality of wastewater and also further reducing the proportion of harmful impurities it contains. To reduce water use, we have defined suitable local consumption-related measures for the sites in our environmental program. Examples of this include closed water cycles and the optimization of production processes. As part of “Strategy 2025”, we have set ourselves the goal of reducing specific water use by 10 % by 2025 compared with the base year 2019.
Water balance
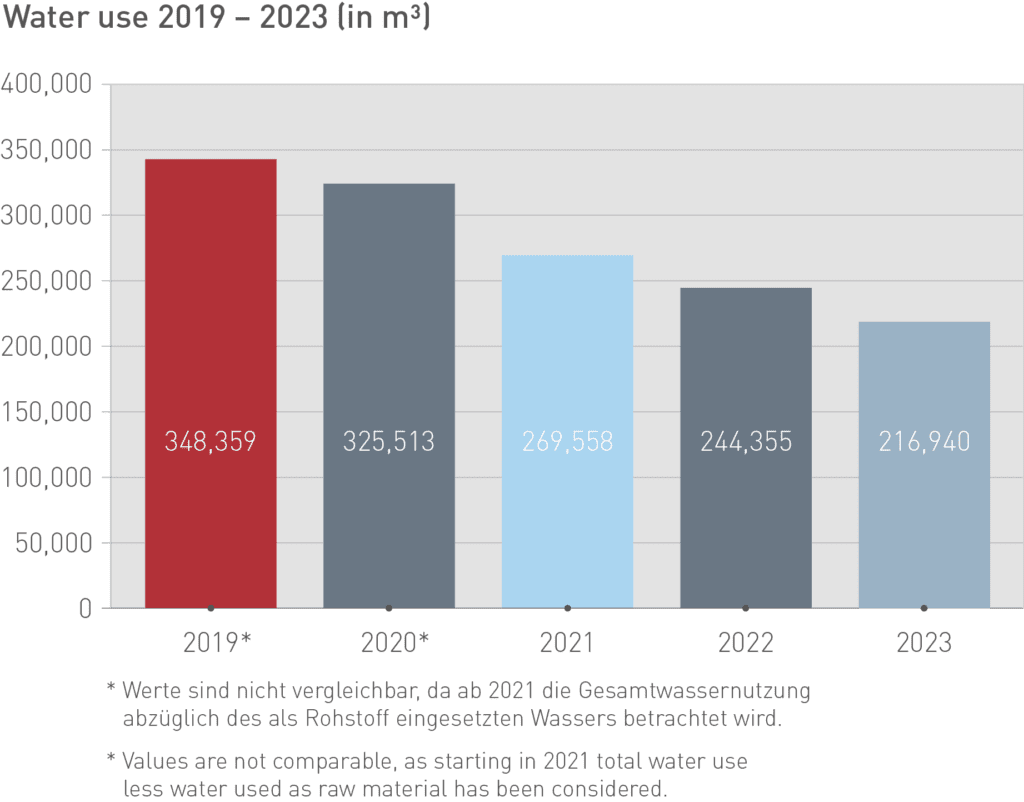
In 2023, the total water procurement of the entire group of companies was 284,641 m³. Compared with 2022, this was a reduction of 11 %. The total water procurement includes 67,701 m³ used as a raw material. As of 2021, the specific water use has been evaluated and reported without raw material water.
Evaluating specific water consumption is a key figure representing our specific water use. In relation to production volume, 2.3 % less water (30 l/metric ton) was consumed in 2023 than in 2019, but 1 % more than in the previous year. The increase in specific water use compared with 2022 can be explained by the following factors: the construction activities in the USA and the construction and commissioning of the production facility in Bangladesh in May 2023 increased water use without any associated increase in production. In addition, in line with the circular economy, empty containers are increasingly being washed and reused at all sites worldwide to avoid waste and reduce the consumption of plastic. In doing so, we use more water.
The reduction in specific water use compared with 2019 is evidence that successful water-saving measures have been implemented worldwide, e.g. improved monitoring of water flows, elimination of leakages, investment in water-saving boiler cleaning and container washing systems, as well as investment in closed-loop cooling systems and consistent recycling of rinse water.
The CHT Group’s water consumption amounted to 99,270 m3 in 2023. Water consumption is essentially based on the evaporation of water and the water contained in our products.
An important part of our water management is a complete and comprehensive overview of data as well as the continuous analysis and implementation of improvement measures; e.g. rainwater harvesting, reuse of treated wastewater and investment in recycling.
Water emission
The CHT Group complies worldwide with the legal regulations regarding wastewater quality. Both internal audits and local authorities regularly check whether the analyses and safety precautions at our sites comply with internal regulations and legal requirements.
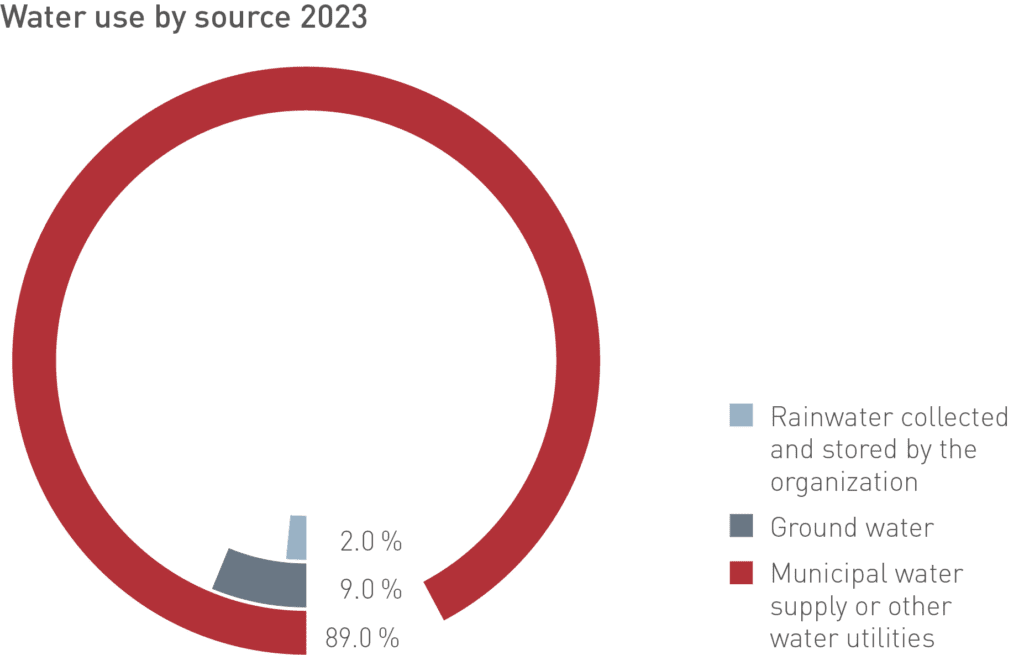
15 of our 25 production sites have their own water treatment or sewage treatment plant. In 2023, the wastewater amounted to a total volume of 155,638 m³. Compared with 2022, approx. 14 % less wastewater was emitted.
A total volume of 134,967 m³ (87 %) of pre-treated wastewater was discharged into municipal and public wastewater treatment plants and 10 % directly fed into a water body. Around 1 % of the wastewater volume remains in local recycling at the site and 2 % are disposed of as waste.
Early in the production process, it is important for us to keep the volume of wastewater and the pollutant load as low as possible and to reuse wastewater and material flows internally wherever possible. When treating our wastewater, we rely on centralized measures in the wastewater treatment plants as well as partial pre-treatment of wastewater. Water protection measures are in place at the production sites to prevent unforeseen emissions and pollution of surface water and groundwater.
Waste
Preventing waste is of major importance for CHT. That is why we regularly train our staff in handling and preventing waste. Unavoidable waste is recycled wherever possible. All non-recyclable waste is subject to proper disposal. Furthermore, the legal requirements and local standards of the specific countries are considered for waste disposal.
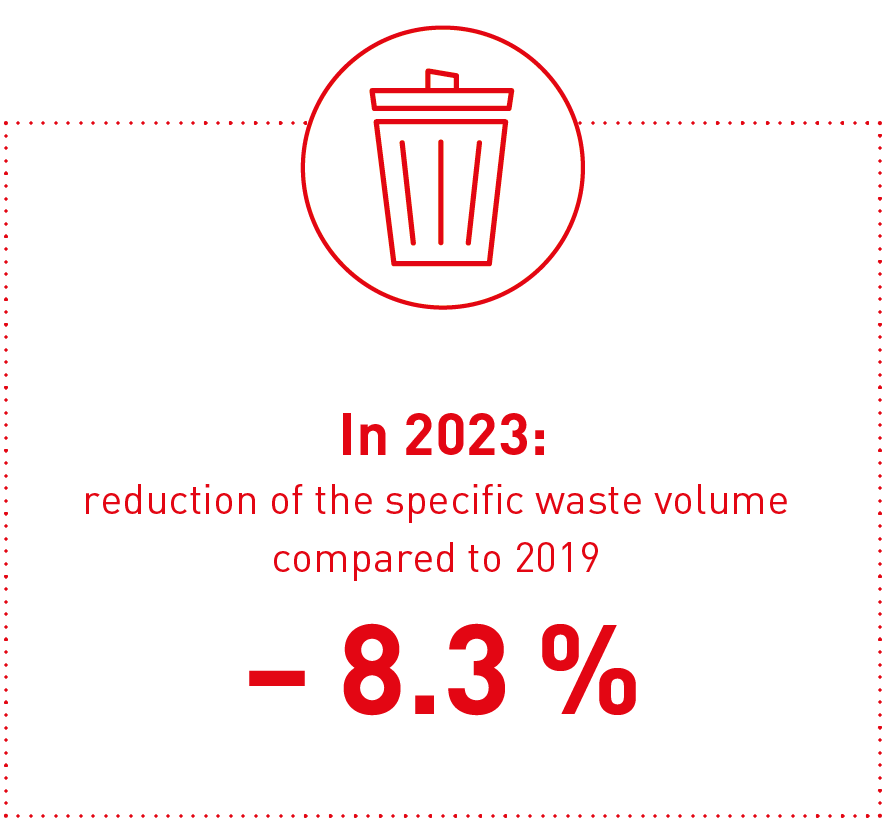
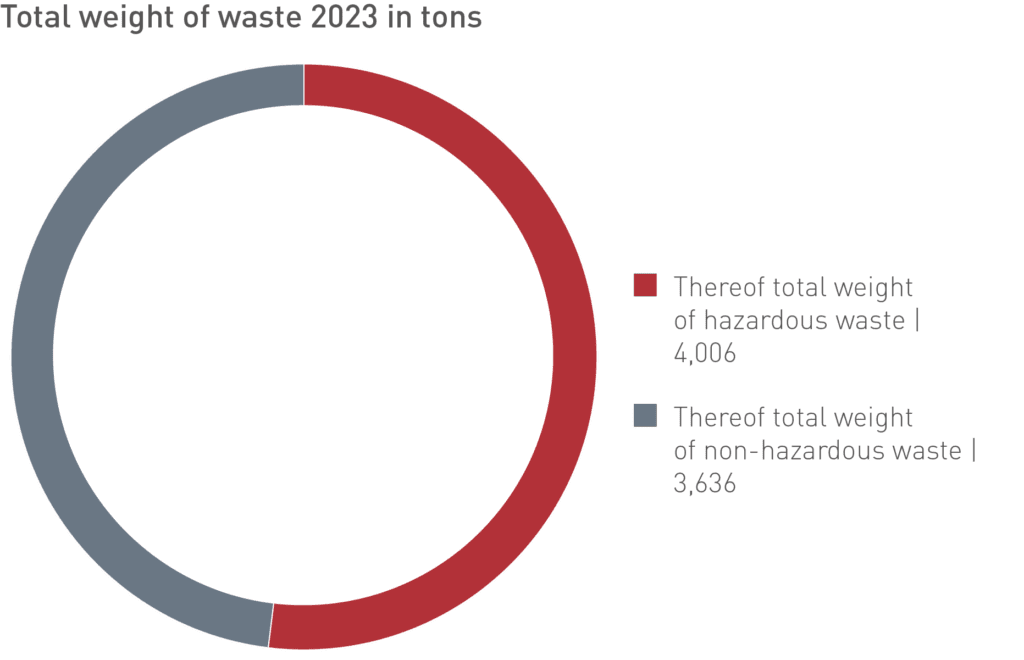
In 2023, the total amount of waste for the entire group was 7,642 metric tons (2022: 9,388 metric tons). The comparison with 2022 in absolute terms shows that the total volume of our waste has declined by 19 %.
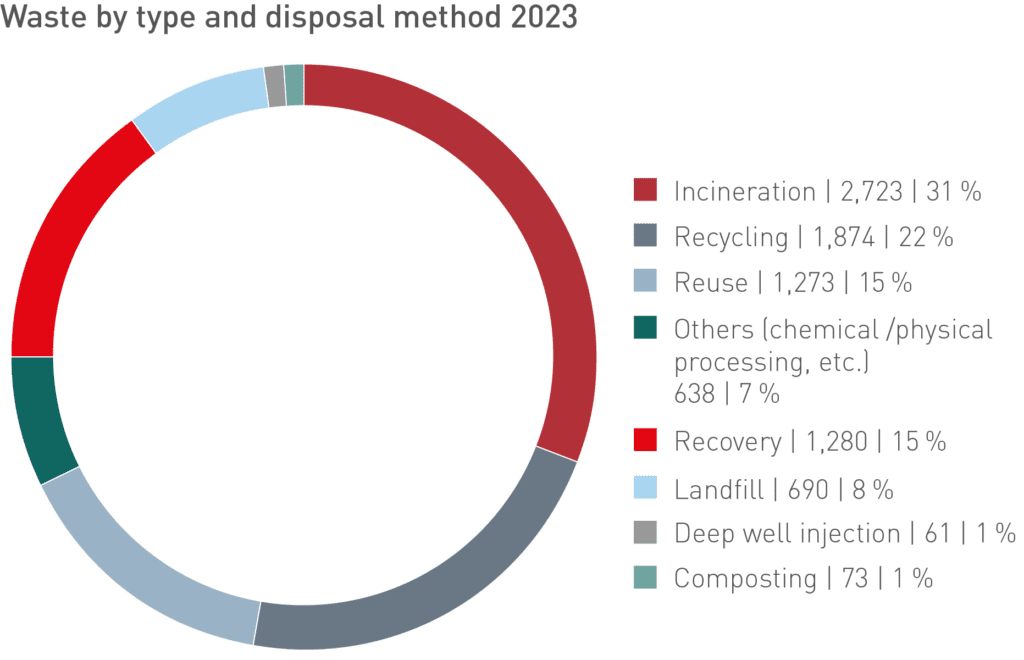
40 % of waste was recycled or recovered in 2023.
In the context of the circular economy, reuse is becoming an important factor, which can be realized in the chemical industry essentially in the case of packaging material. In 2023, the amount of waste was reduced by approximately 3,045 metric tons because containers could be reused internally or externally after a cleaning.
The share of hazardous waste was 52 % of total waste in 2023. The total volume decreased by 17 % compared with 2021. Hazardous waste is generally incinerated or handed over to specialist disposal companies for recycling.
Energy and climate protection
For the manufacture of chemical products energy in different forms is needed. We purchase it in the form of electricity, oil, natural gas, liquid gas (LPG), wood pellets as well as local and district heating. Energy is used for operating our production plants and for heating our company buildings. During recent years we have been able to successfully implement different measures for energy savings, and to consistently enhance our energy efficiency.
We are committed to climate protection and to the Paris Agreement to limit global warming to 1.5 °C. For this reason, we have committed ourselves to SBTi and have set ourselves short and long-term climate protection targets and to be net zero by 2045.
The digital transformation is an important task for the future of humanity and at the same time a major challenge for a company like CHT.
Our global climate protection goals:
- - 42 % reduction of our greenhouse gas emissions in Scope 1 + 2 by 2030
- - 25 % by 2030 in Scope 3 (SBTi-compliant)
- Net-zero greenhouse gas emissions by 2045 (Scope 1, 2 and 3)
As part of our commitment to climate protection, we have identified nine strategic levers:
- We are increasingly meeting our electricity demand without fossil fuels
- We are reducing our specific energy consumption by 10 % by 2025 while increasing the energy and process efficiency of our internal processes
- We are increasingly replacing fossil raw materials with bio-based or recycled raw materials
- We develop products and processes that consume less energy in customer applications
- As part of our climate protection activities, we want to operate our facilities even more efficiently and make our processes even more resource-efficient. Of particular importance in this context are certified energy management systems to DIN EN ISO 50001, which we aim to introduce strategically at all relevant production sites by 2025. They help us to identify and implement further opportunities for improvement in energy efficiency. This not only reduces greenhouse gas emissions and saves valuable energy resources, but also increases our competitiveness. In 2023, all German sites, Istanbul (Turkey), Lahore (Pakistan), Navi Mumbai (India) and Sesto Ulteriano (Italy) had certified energy management systems. At the Montlingen site in Switzerland, energy efficiency is certified according to a Swiss standard
- Based on specific energy consumption in 2019, a 10 % reduction by 2025 was agreed as a goal for all production sites. In 2023, specific energy consumption was reduced by 6 % compared to 2019
- As part of our sustainability commitment, we intend to increase our energy efficiency over the long term at all CHT sites worldwide
- The Global Sustainability Management has set up a group-wide reporting tool for the standardized recording and evaluation of global energy consumption and the central calculation of greenhouse gas emissions
- The Global Sustainability Management develops the CHT Group's climate targets and is responsible for the strategic levers for achieving these targets
By reducing our own emissions and those upstream in the value chain, we contribute to achieving our customers’ climate protection targets. To increase transparency, we have started to calculate the CO2 footprints of the products manufactured at our German production sites.
Energy supply
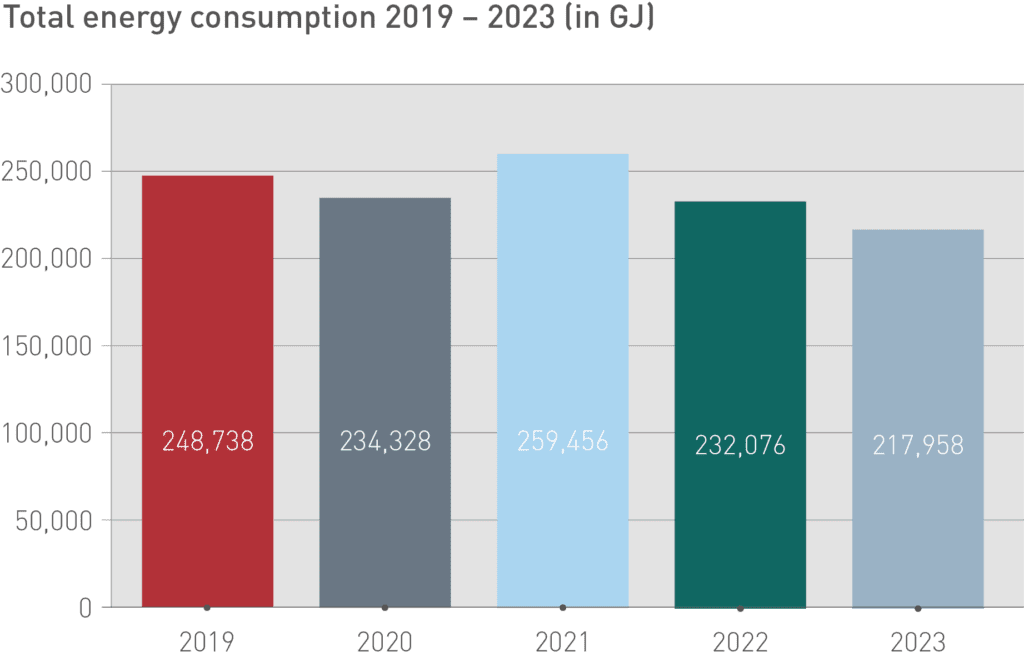
The worldwide energy consumption of the CHT Group amounted to 217,916 GJ in 2023. In direct comparison with 2022, the absolute energy consumption decreased by 6 %. Total energy consumption includes primary energy requirements for the company’s own steam generation plants and heating systems, as well as net electricity and steam purchases.
Lower production volumes compared with the previous year and actively implemented energy-saving measures have led to this reduced consumption. Specific energy consumption per ton of production volume in 2023 remained unchanged compared with 2019. Global energy management implemented in previous years has shown good results with significant reductions, however this could not be continued in 2023. New production facilities and increasing vertical integration and the resulting longer occupancy times of reaction boilers lead to significantly higher energy requirements. These changes in the product mix and aggregate mix are evaluated separately and analyzed by internal teams with regard to their potential for optimization.
Energy use, and thus specific energy consumption, is closely linked to utilizing the capacity of our plants and the production portfolio. The renewed increase in 2023 compared with previous years is due not only to the new plants but also to a lower and uneven utilization of our plants compared to the previous year, which resulted in a deterioration in plant efficiency.

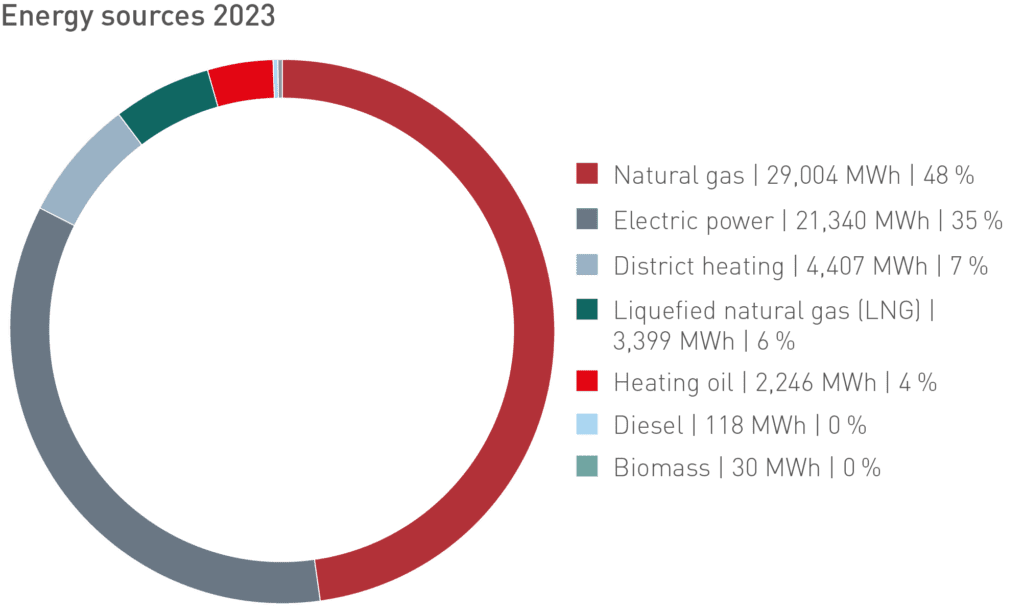
We mainly use natural gas (83 %) and LNG (10 %) to generate our own heat and steam.

An important element for reducing our greenhouse gas emissions will be the gradual conversion of energy supply from fossil sources to renewable sources.
In 2023, 28 % (vs. 24 % in 2022) of total energy requirements were already covered by renewable energy sources.
At the site in Oyten (Germany), two combined heat and power plants are operated with biogas by an external provider. The heat generated by the CHP units is used to heat all buildings at the site, a heating chamber, production processes, and raw material storage tanks. In 2023, heat procurement amounted to 2,564 MWh (77 % of the heat energy used at the site).
The Tübingen site purchased 1,633 MWh of district heating in 2023.
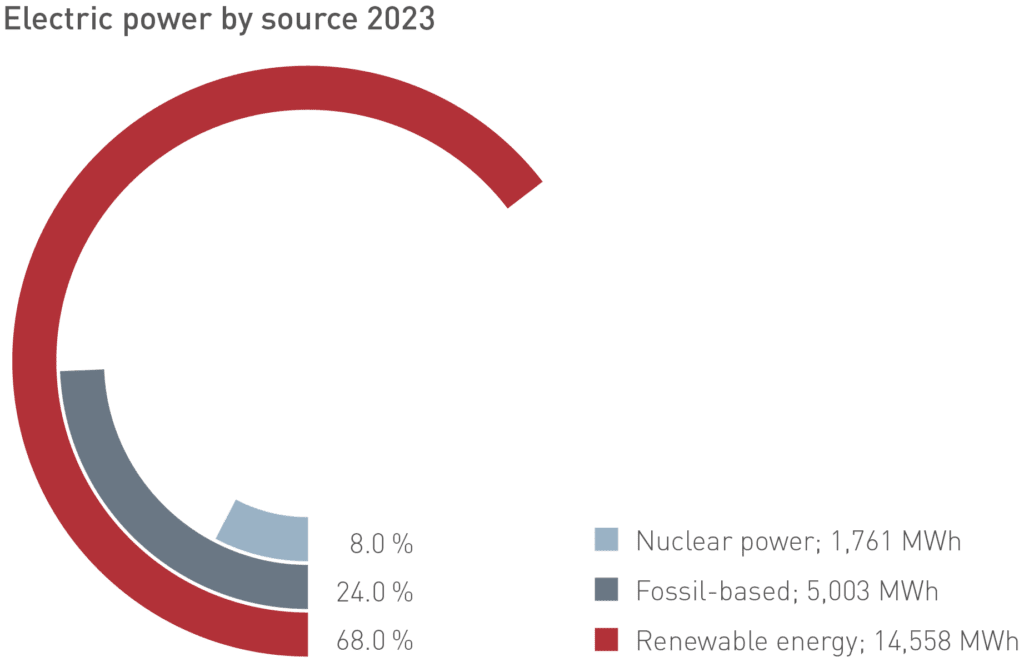
In 2023, 68 % of electricity across the CHT Group was covered by renewable energy sources. Compared to 2019, this is an increase of 58 %.
In transforming our electricity supply, we are not only taking the approach of buying more green electricity on the market, but also producing electricity in our own photovoltaic plants.
In 2023, CHT’s own photovoltaic plants supplied the following shares of local electricity demand: Switzerland 11 %, Austria 44 %, Pakistan 34 %, Australia 33 %, Dusslingen 4 %, South Africa 68 %, and in Mexico: installation of a new plant.
Carbon footprint 2023
For the year 2023, we report the CHT Group’s climate footprint for Scope 1 – 3. Scope 3 reporting only includes the Scope 3 categories that were selected as material for the CHT in the materiality analysis carried out for Scope 3. All 28 companies (+ 3 vs. 2021) including all production sites and offices are included in the CHT Group’s 2023 carbon footprint.
The preparation of the carbon footprint follows exactly the Greenhouse Gas Protocol standards and the sector-specific standard for the chemical industry published in 2013.

EMISSIONS ALONG THE VALUE CHAIN

Greenhouse gas emissions along the CHT value chain
The balance distinguishes between three emission areas, the so-called Scopes:
- Scope 1 covers direct CO2 emissions. They originate from emission sources at CHT sites. These include, for example, our own production facilities and facilities for steam generation
- Scope 2 relates to indirect CO2 emissions arising from our suppliers in the generation of energy that we purchase for our sites
- Scope 3 includes all other CO2 emissions that occur upstream or downstream along the value chain (see materiality analysis with categories selected for CHT)
Scope 3: materiality analysis
All Scope 3 categories were evaluated according to their materiality (emission level) and degree of influence on the activities of the CHT Group. We identified categories 3.2, 3.3, 3.5, 3.6 and 3.7 with low emission levels, but with more or less influenceability, and therefore classified them as material. We identified categories 3.1, 3.4, and 3.9 with high emissions as material and assigned them the highest priority level. In the climate assessment, we will include indirect down-stream category 3.12, which we identified with a medium level of emissions but low influenceability. In accordance with the WBCSD Scope 3 Chemical Sector Guidance, category 3.10 “Further processing of sold products” will not be accounted for. However, we have balanced the emissions and included them as emissions to be reduced in accordance with the SBTi* guideline. Category 3.11 “Use of sold products” is not material for CHT and will also not be accounted for. We report on Scope 3.3 to show upstream value chain emissions from Scope 1 & 2, even though the category was identified as hardly material. We identified the remaining Scope 3 categories (3.8, 3.11, 3.13, 3.14, 3.15) as immaterial.

- Identification of the most relevant Scope 3 emission categories based on a defined criteria catalogue
- Evaluation of the materiality in terms of emission levels and possibility of influence
*SBTi does not accept the WBCSD Scope 3 Chemical Sector Guideline for the category, but SBTi does not yet have its own Chemical Sector Guideline. CHT has therefore decided to calculate 3.10 for SBTi and to account for it within the framework of the Corporate Carbon Footprint.
Greenhouse gas emissions in the CHT Group (GHG Protocol Scope 1 & 2)
In accordance with the GHG Protocol Corporate Accounting Standard we report Scope 1 and Scope 2 emissions separately. For Scope 2 emissions, we consider both the location-based approach and the market-based approach. Data is collected for all group companies consolidated in CHT’s financial reporting.
| GHG inventory market based method in CO2e (t/a) | 2023 |
|---|---|
| Total emission Scope 1&2 | 13,769 |
| Scope 1: direct emission | 9,814 |
| Energy consumption | 7,253 |
| Heating oil | 641 |
| Natural gas | 5,878 |
| Diesel | 30 |
| LNG | 540 |
| Biomass | 0.29 |
| Company cars | 2,571 |
| Scope 2: indirect emission | 3,955 |
| Electrical power | 3,681 |
| District heating | 273 |
Scope 1 emissions of the CHT Group were captured from operating records and using financial accounting data.
Scope 1 emissions do not capture direct emissions of volatile gases, as these emissions are not generated in CHT’s production processes. An analysis of the cooling systems operated throughout the group has shown that emissions of the cooling agents in use occur to an undetectable extent due to continuous leakage checks.
Scope 1 emissions cover the entire CHT Group vehicle fleet including trucks and forklifts; both leased and purchased vehicles were included.
Scope 2 emissions are determined using both the location-based method with emission factors from ecoinvent and the market-based method based on location data. The carbon footprint for Scope 1 + 2 using the location-based method resulted in emissions of 18,077 metric tons of CO2(e) for 2023. We have decided to use the carbon footprint based on the market-based approach as the standard for the CHT Group (see table above).
The year 2021 is set as the base year for the CHT Group’s climate reporting. Accounting data is collected globally with an internal online tool and converted to CO2(e) emissions using independent, standardized emission factors. In 2022, the complete greenhouse gas balance was reviewed and approved by the sustainability and climate consulting company sustainable AG. sustainable AG has made recommendations for action that have meanwhile been implemented in the group-wide carbon footprint.
A change in the calculation standard or a recalculation of the baseline carbon footprint is only recalculated on the basis of subsequent climate data if decisive structural changes, such as acquisitions, divestments or mergers, take place as part of M&A projects.
In 2023, our greenhouse gas emissions under the Greenhouse Gas Protocol, taking into account Scope 1 and Scope 2 (market-based approach), amounted to 13,769 metric tons of CO2 equivalents (e) (2022: 15,032 metric tons). Of this, 71 % was attributable to Scope 1 (2022: 70 %) and 29 % to Scope 2 (2022: 30 %). Carbon dioxide was by far the largest component of emissions, accounting for > 99 % (2022: > 99 %).
The calculation of Scope 3 greenhouse gas emissions generated upstream and downstream of our value chain operations follows the Corporate Value Chain (Scope 3) Accounting and Reporting Standard under the Greenhouse Gas Protocol and includes the use of generic database values. For 2023, we have determined Scope 3 emissions of 442,356 metric tons of CO2 equivalents (2022: 459,937 metric tons). Due to the lower production volume, there was a significant reduction in total emissions along the CHT value chain in 2023.
The largest contribution to Scope 3 occurred in 2023 with 354,745 metric tons of CO2 equivalents (2022: 370,273 metric tons) from purchased raw materials, packaging, operating materials and services. To calculate these upstream greenhouse gas emissions, we used information from external databases, e.g. ecoinvent. They will gradually be replaced by data provided to us by our suppliers.
The second largest contribution to Scope 3 came from transports from the upstream and downstream value chain with 35,745 metric tons of CO2(e) (2022: 39,261 metric tons).
Waste disposal accounted for 8,622 metric tons of CO2 equivalents (2022: 7,902 metric tons) emissions. The value is based on CHT disposals. The increase in waste-related greenhouse gas emissions despite a significant reduction in the volume of waste is due to the improved data situation and more precise information on disposal routes.
We assess the end-of-life scenarios of our products in Scope 3.12 for the year 2023 with 21,072 tons of CO2(e).
Scope 1-3 emissions along the CHT value chain in 2023
Total Climate Balance

CHT offers numerous products that make a positive contribution to greenhouse gas emission savings in their applications – compared to conventional alternatives.
A balancing of the emissions avoided by the products has not yet taken place, but will be discussed anew as part of the preparation of the climate strategy.
CO2 footprint of our products
In order to increase transparency about our product-specific greenhouse gas emissions, we have successively started calculating the CO2 footprints of our sales products as of 2023. These so-called Product Carbon Footprints (PCFs) include all greenhouse gas emissions from raw material extraction to their leaving the factory gates (“cradle-to-gate”). The PCFs provide us with important information for assessing the climate impact of our products and indications for implementing mitigation measures so that our customers can benefit from reduced CO2 emissions in the value chain. The method we use to calculate PCFs is in line with the “Together for Sustainability” TfS Guideline, which was introduced to the market as an industry standard in September 2022. As a basis for the calculation of upstream Scope 3 emissions, industrial average values and values from commercial databases are used as far as possible, which we will gradually replace with primary data from our suppliers.
In 2023, we added the first footprint-reduced product alternatives to our existing range to our portfolio. To this end, we use partially or fully renewable, waste-based or recycled raw materials.
In 2024, we will invest in a digital tool to calculate the PCF.